Floor and ceiling effects

This article builds on Haqiqatkhah et al. (2024).
This article is about floor and ceiling effects in empirical psychological data, which occur when a measurement instrument has a lower or upper bound that leads to the clustering of scores around the ends of the scale.
The floor effect is common in intensive longitudinal measurements of Negative Affect (NA) items, especially when the sample contains non-clinical individuals: Healthy individuals tend to experience fairly little negative emotions, and hence, many of their scores will be equal or close to zero. Similarly, the ceiling effect may occur in Positive Affect (PA) items of individuals with higher mental well-being.
It is important to consider these effects, because:
Understanding how and why these effects occur are an important part of understanding and controlling the measurement process;
Understanding how and why these effects occur is an important part of understanding the substantive process under study substantive theory;
These effects may have consequences for analyzing and modeling the resulting intensive longitudinal data (ILD). Understanding when, how, and why these effects occur allows you to find optimal ways to do the analysis/modeling.
In this article, you will find: 1) what floor effects are and 2) ceiling effects are (with an emphasis on the former); 3) theories on the possible mechanisms leading to them, 4) ways of detecting these effects in a given data set; and 5) the implications and consequences of these effects for common models used in psychological research.
1 What is the floor effect?
Many of the common scales used in psychological research measure counts or unipolar constructs, and are thus lower-bounded, meaning that individuals cannot score less than a certain value on the scale: A person cannot sleep less than zero hours, smoke less than no cigarettes a day, face less than zero stressful events in a day, or feel negative distress.
Due to the lower bound on the scale, certain (groups of) individuals, especially those with lower average values of the measure, are expected to provide answers close—or equal—to the lowest value on the scale. This essentially leads to a clustering of measurements around the lower bound of the scale, thus leading to a positively skewed distribution of responses, with relatively small variability for that construct. This phenomenon is often referred to as a floor effect, which is reflected in the individual histograms of responses.
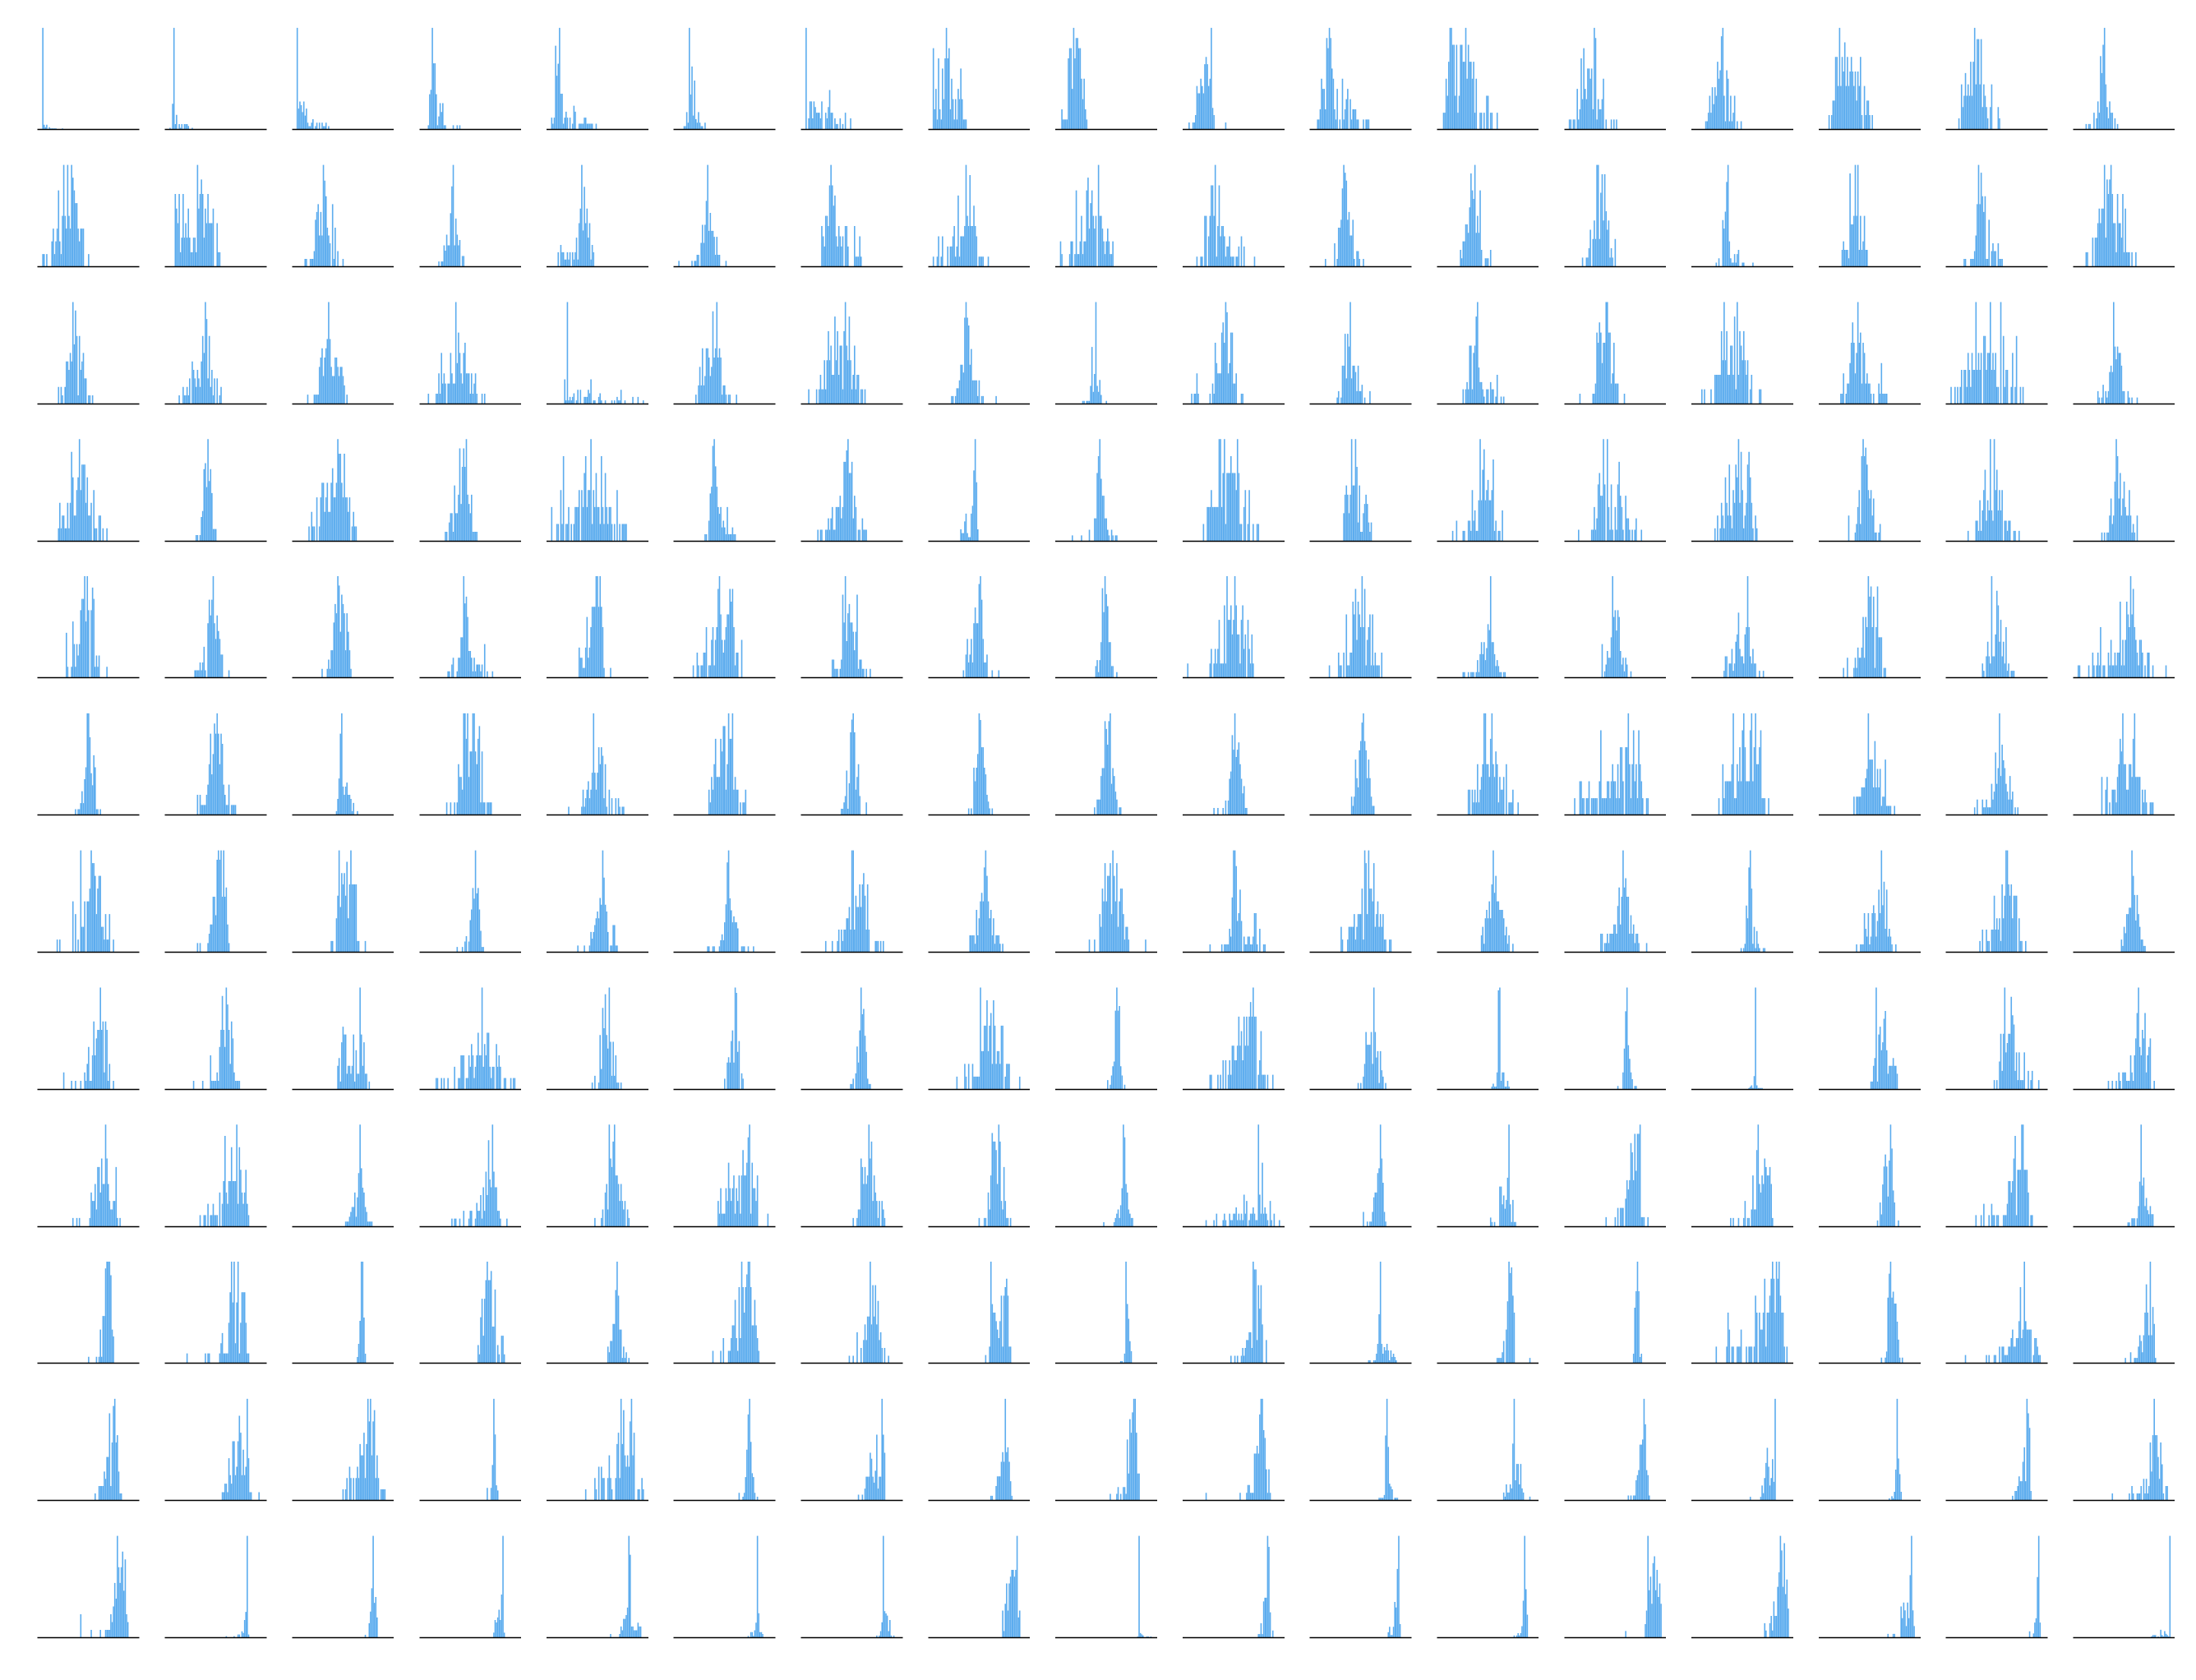
Floor effect can be present in measures of negative affect and can be easily spotted if the data is measured on a Likert scale, for instance, from “Not at all” to “To a great extent”; an individual cannot report values below “Not at all”, and hence the scale is bounded. Figure 1 shows individual histograms of distress scores of individuals in the COGITO dataset (Schmiedek et al., 2010), sorted by individual mean (who were measured for around 100 consecutive days). As the histograms show, a strong floor effect is evident for more than half of the individuals.

Note that the floor effect in ILD is primarily a within-person (level-1) phenomenon (i.e., for single participants, when many of the repeated measures of that participant are at the lower bound). However, it can also occur at a between-person level (i.e., with many of the participants score low on the construct), either when individuals are measured cross-sectionally, or when person-specific (i.e., level-2) averages are calculated. As explained in Section 5, a floor effect at level-1 can lead to floor effects at level-2.
2 What is the ceiling effect?
As well as a lower bound, many of the common scales used in psychological research also have an upper bound, which is inevitable when qualitative constructs (particularly, non-count variables) are being measured; without an upper limit on a lower-bounded scale, one can no longer interpret the magnitudes and differences in scores within and between individuals. Assume Bao and Mio are asked to report happiness scores from zero up to infinity on four occasions; Bao reports happiness values 10, 5, 15, and 20, and Mio reports 40, 20, 60, and 80. Given that we do not know the extent to which these individuals can experience happiness, we may not conclude that Mio is generally happier than Bao; it could be the case that Mio is reporting happiness in increments of 20 (so Mio’s 80 is equivalent to Bao’s 1), or it could be that Mio reports in increments of five (so Bao’s 10 is equivalent to Mio’s 2).
The ceiling effect, manifested as a clustering of measurements around the upper bound of the scale, emerges when some (groups of) individuals with higher average values of the measure frequently provide answers close—or equal—to the highest value on the scale. This clustering leads to a negatively skewed distribution of responses, with relatively small variability for that construct for those (groups of) individuals. Similar to the floor effect, the ceiling effect is reflected in the individual histograms of responses.
As an example, we can look at Figure 2, which contains the individual histograms of the measured Positive Affect (PA, which is the unweighted average of 10 positive emotion items) in the COGITO dataset (Schmiedek et al., 2010). It can be seen that some individuals are characterized by the floor effect, and some with the ceiling effect.
3 Floor and ceiling effects due to measurement or instrument design
Multiple factors may induce the floor or ceiling effects in empirical data. In this section, we explain how they can be due to the properties of the measurement or instrument design.
3.1 Coarse-grained categories at the end of the scale
In some scenarios, the lowest (or highest) item on the scale either has a low resolution (which can accommodate multiple values) or has an arbitrary cut-off threshold. In such cases, the scale lacks sensitivity in distinguishing changes in the levels of the construct at the ends of the scales, which can lead to floor and ceiling effects. See Vermeersch et al. (2000).
Elif is studying the effect of a specific diet on individuals’ mental and physical well-being using the experience sampling method. She asks: How does the diet affect daily experiences of headache and other physical discomforts?
To measure headache, she uses a scale with the lowest item being “No headache at all or very slight headache”. This option will be selected by those who are experiencing no headache at all as well as those who have a very slight of headache, meaning that the item has low resolution in measuring those with small amounts of headache.
Zephyr is studying the relationship between smoking and sleep quality in a daily diary study with a morning and an evening questionnaire. He asks: How do daily sleep duration and cigarette consumption are inter-related in regular smokers?
To capture sleep duration, Zephyr asks participants how much sleep they had the night before in the morning questionnaire. Since many individuals do not sleep more than 10 hours a day, Zephyr collapses the uncommonly large values a single category of “10 hours or more”. This leads to an arbitrary ceiling in his scale, leading to a ceiling effect in the data of individuals who sleep a lot.
At the end of the day, Zephyr asks about the number of cigarettes that the participants smoked throughout a day. Although it is possible to smoke dozens of cigarettes in a single day, Zephyr believes that most individuals do not smoke more than a pack of cigarettes a day, and thus sets the highest value on the scale to “20 cigarettes or more”. This decision may lead to the ceiling effect this variables for heavy smokers.
From a psychometric perspective, such lack of sensitivity may also arise due to extreme formulation of the items, causing the difficulty parameter (or threshold) of the item to become high (Oord & Ark, 1997), thus making it difficult accurately to distinguish between levels of the construct across individuals or its change over time within an individual (Guyatt, 1988).
3.2 Measuring a bipolar construct with a unipolar scale
Some affect and mood items, like “sad” can be thought of as measuring one half of a bipolar latent continuum, say, “happy–sad”. As such, being “Not at all sad” is equivalent to being “Neither happy nor sad”.
Another example is the item “distressed” (see Figure 1), which can be thought of as being one half of the “relaxed–distressed” continuum.
In such cases, measuring one half of the latent construct with a unipolar scale can be thought of as systematically left-censoring the data. As Falcaro et al. (2013, p. 12) put it:
“The depression score variable in this study suffered a marked floor effect at 0. We decided to treat this as a special case of interval censoring. Under this model we are assuming that those who score at the floor of the test could have been further differentiated into varying levels of non-depression if there had been appropriate additional items. Most people would call such variation in non-depression variation in happiness but, in the absence of actual happiness items and evidence of their tapping the same dimension as the depression items, the labeling of any such implicit variability is best left open.”
3.3 Censoring by participants
Participants give meaning to the start/end of a scale which turns out not extreme enough. Later on, they experience more extreme emotions, but they are bounded by the initial interpretation they gave to the start/end of a scale.
3.4 Sampling issues or missing not at random (MNAR) observations
Some sampling schemes may lead to more data being collected when the behavioral or psychological process being measured is at lower levels of intensity. This issue may emerge as missing not at random due to participant behavior; for instance, some individuals may miss extreme scores at the end of the scale when feeling anger, leading to a floor effect. On the other hand, [study designs], such as [event-contingent designs] may only observe variables—that are not generally experienced with high intensity—in the context of relatively extreme (yet relatively infrequent) events or emotions. For instance, measuring individuals when they have a panic attack would result in apparent ceiling effects for anxiety and distress, which, if measured at semi-random occasions, would generally show a floor effect.
4 Floor effects due to the nature of the process
Floor effects may also occur due to the nature of the process. In this section, we explain how the true distributional nature or sub-processes may appear as floor effects.
4.1 Specific distributional natures
It is possible that some psychological processes, in nature, produce data with non-symmetric distributions, such that they have a higher density (or mass) near zero. Such processes, especially when dealing with counts (e.g., number of stressful events or behaviors like smoking or drinking)—or constructs that can be approximated with counts (e.g., negative thoughts or emotional episodes measured by their counts)—may follow, for instance, the binomial distribution (see Iachina & Bilenberg, 2012), Poisson distribution, or skewed distributions akin to the \(\chi^2\) distribution (Haqiqatkhah et al., 2024). The latter can be the case when the data is collected using nearly-continuous scales (such as a 0-100 visually assisted scale [VAS]), or if the data is an aggregate or average of multiple items measured on discrete-valued (e.g., Likert) scales.
As an example of semi-continuous data, we can look at the daily average values of 32 items measuring daily expression of personality disorders (Wright & Simms, 2016) taken from 98 individuals participating in a daily diary study (with up to 101 days of measurement) conducted by Wright et al. (2015). Figure 3 contains the individual histograms of this variable, showing that almost one-third of individuals manifest the floor effect to some degree.

4.2 Sub-processes (zero inflation)
Some behavioral and psychological processes can be thought of as a mixture of two processes: One acting as an on–off switch (determining whether the process is active or not), and another process generating non-zero values. It has been suggested that dietary intake (Ruf et al., 2021), smoking behavior (Liu, 2007), and certain affective processes (Lu et al., 2019) might be better explained in this framework.
It is worth noting that such processes can explain the excess number of zero values (or zero inflation) in the data; if the data is skewed beyond zero inflation (i.e., has high mass for small positive values), the “on” process itself still needs to account for a “floor effect” that is present above zero.
As a concrete example, if we measure the amount of daily alcohol consumption of individuals, we will have non-negative values, as it is impossible to consume less than zero amount of alcohol. Furthermore, since an individual on a given day either abstains from consuming alcohol or consumes it, we would expect this behavior to have the on–off switch. Figure 4 shows the number of alcohol units consumed per day (measured as a count variable) by 98 individuals participating in the daily diary study conducted by Wright et al. (2015). Almost all individuals show a clear floor effect due to zero-inflation, and some of them show the floor effect in their “on” process.

5 Detecting the floor effect in empirical data
As shown in Figure 1, Figure 4, and Figure 3, the floor effect in the responses of individuals is reflected in their person-specific histograms. It is also possible to methodologically investigate the presence of the floor (and the ceiling) effect in a dataset consisting of many individuals by studying the pairwise distributions of individuals means, variances, and skewness values.
As mentioned earlier, the floor effect is characterized by the co-occurrence of low mean, small variance, and a positive skewness of an individual’s response distribution. Thus, at the presence of the floor effect in the data, we would expect to see a positive correlation between the individuals’ mean and the variance (low means coincide with low variance), negative correlations between the skewness and the mean (low means coincide with high positive skewness), and negative correlations between the skewness and the variance (low variance coincides with high positive skewness). See Haqiqatkhah et al. (2024, Appendix A) for more details.
Manuel wants to investigate the degree to which the floor effect is present in the distress variable from the COGITO dataset (Schmiedek et al., 2010), which was shown in Figure 1. By mere eyeballing the data, it is evident that many individuals show different degrees of the floor effect, but he needs a better view of its presence at the sample level. To do so, he looks at the distribution of summary statistics of individuals—that are the mean, variance, and skewness of each person—within the sample, and visualizes them in a pairplot shown in Figure 5. This figure shows the distribution of the summary statistics in the diagonal panels, their pairwise joint distributions as scatter plots and their correlations in the off-diagonal panels.
He observes that lower means of distress very often coincide with smaller variability (leading to a positive correlation between mean and variances) and more asymmetry (leading to a negative correlation between mean and skewness), which is characteristic of data with a floor effect. The lower left panel of this figure (the scatter plot of skewness based on mean) shows that most of the individuals have very low means and very high skewnesses, indicating that the floor effect in individuals (at level 1) brings about skewness in means (at level 2).
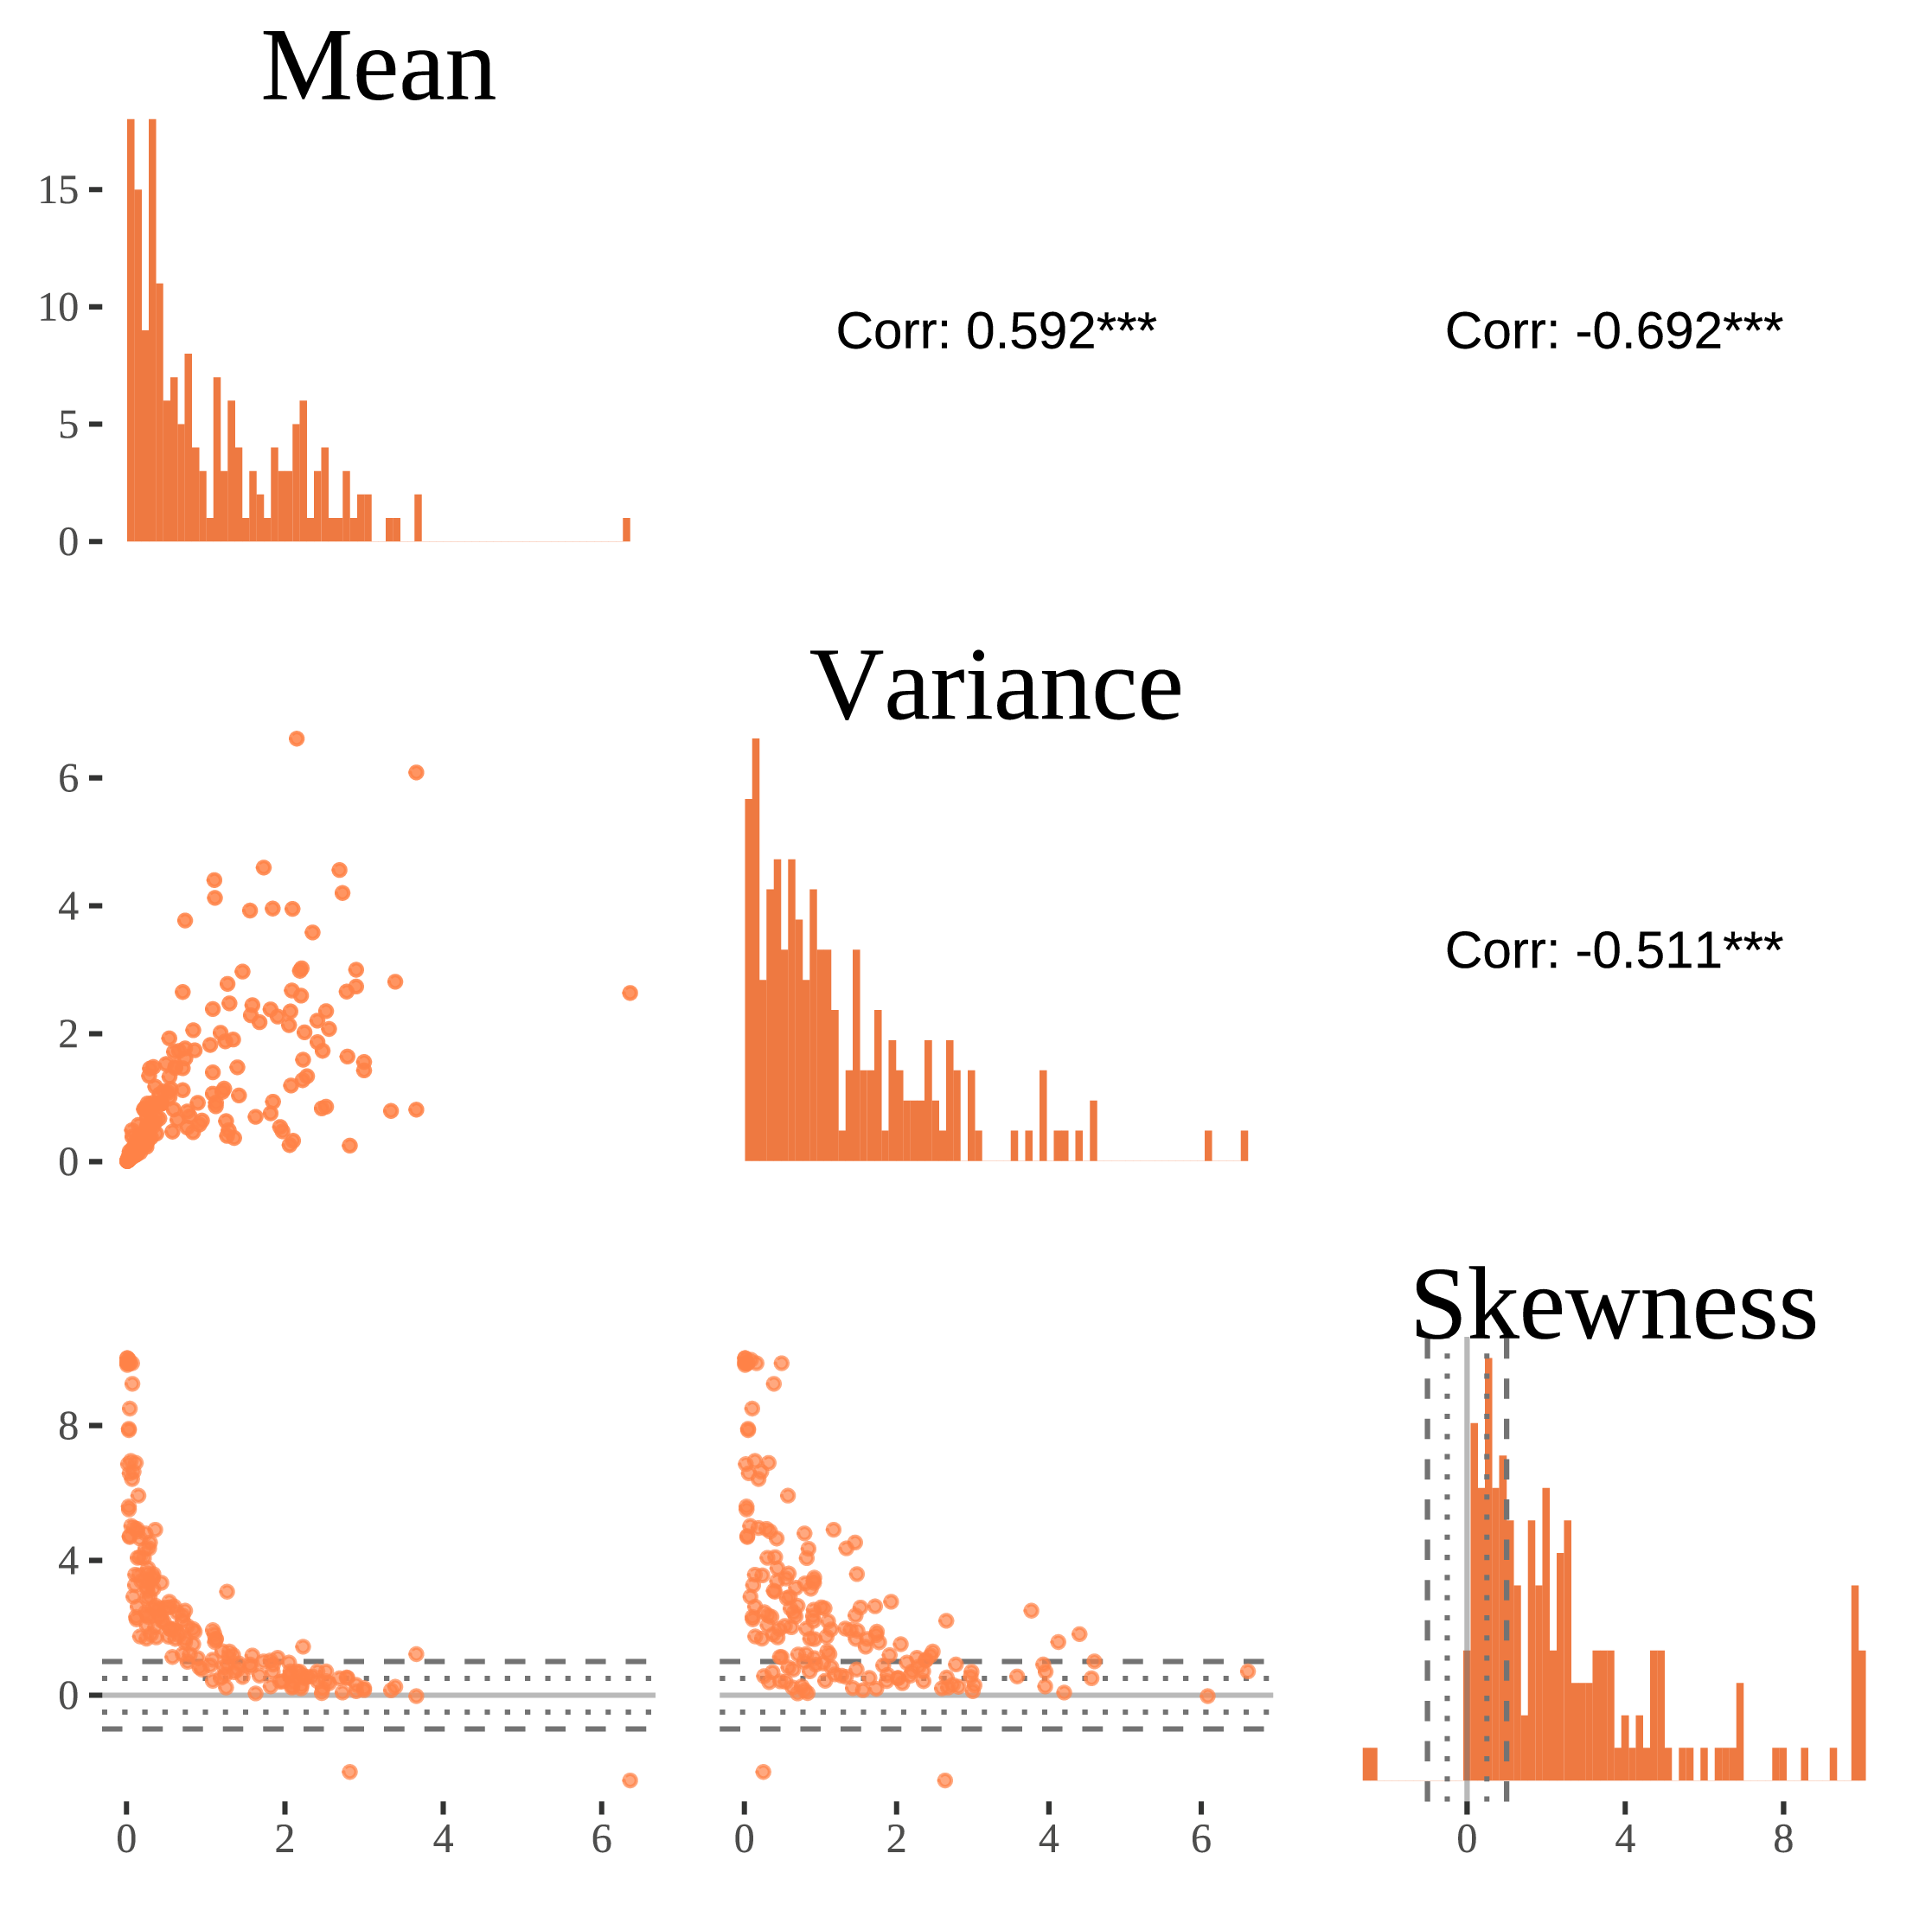
(This example is based on Haqiqatkhah et al., 2024.)
On the other hand, if the data shows the ceiling effect, we would expect a negative correlation between individuals’ skewness and mean (high negative skewness values due to the ceiling effect values coinciding with high means), a negative correlation between mean and variance (distributions with higher means have lower variances) and a positive correlation between skewness and variance (Haqiqatkhah et al., 2024).
Manuel suspects that the average PA scores in the COGITO dataset (Schmiedek et al., 2010) may be influenced by the ceiling effect, as he has noticed its indication in individual histograms in Figure 2. He makes the pairplots for the individuals’ summary statistics (i.e., mean, variance, and skewness) within the sample, which is shown in Figure 6.
He observes that the distribution of means (upper left panel) is more symmetrical than that of distress (which was shown in Figure 5); however, as the histogram of skewnesses shows (lower right panel), many individuals have either positively or negatively skewed responses (notice that many of the skewnesses are either more than 1 or less than \(-1\), typically used as thresholds for high positive and negative skewness). He observes a negative correlation between mean and skewness, and mean and variance, which likely indicates that more individuals are characterized by the ceiling effect for this variable.

(This example is based on Haqiqatkhah et al., 2024.)
6 Consequences for common models used in psychological research
The floor effect may makes it harder to detect changes different groups of individuals (e.g., in clinical studies) and within individuals (e.g., in panel studies). In intensive longitudinal data analysis, the floor effect leads to biased estimates of the autoregressive effect in multilevel AR(1) models (Haqiqatkhah et al., 2024), and the direction and degree of bias depends on the model being used. When modeling the data with fixed residual variance, the dominant practice in the psychological literature, the floor effect leads to negative bias in the level-2 correlation between the autoregressive parameter and the mean, whereas estimating residual variance as random effects leads to positive bias in the said parameter. See Haqiqatkhah et al. (2024) for more details.
7 Takeaway
The floor and ceiling effects are phenomena that, in many settings, inflict empirical psychological and behavioral data. It is crucial to be aware of the ways they can emerge when designing and conducting studies, and the implications these effects have for data analysis and modeling: Researchers who intend to collect intensive longitudinal data should make informed decisions about the scales and sampling schemes they plan to use to prevent these effects in their data, and detecting and distinguishing different forms of the floor and ceiling effects in the collected data (which may have been inevitable due to the nature of the constructs) allows researchers to choose appropriate models suited for analyzing such data. Additionally, besides considering the floor and ceiling effects as contaminants of psychological data, these effects can be studied on their own (e.g., to better understand the mechanisms leading to them) in available data or in studies specifically designed for such investigations.
8 Further reading
We have collected various topics for you to read more about below.
- Item design
- [Measurement scales]
- [Anchoring for answer options]
- [Answer option design]
- Sampling design
- [Event-contingent Designs]
Acknowledgments
This work was supported by the European Research Council (ERC) Consolidator Grant awarded to E. L. Hamaker (ERC-2019-COG-865468).
References
Citation
@article{haqiqatkhah2025,
  author = {Haqiqatkhah, Mohammadhossein Manuel},
  title = {Floor and Ceiling Effects},
  journal = {MATILDA Preprints},
  number = {2025-05-23},
  date = {2025-05-23},
  url = {https://matilda.fss.uu.nl/articles/floor-ceiling-effects.html},
  langid = {en}
}